


Champion
•
20.7K Messages
•
490.5K Points
Ratings: Compare Ratings History with IMDb Rating
This would be similar to the "Compare to You" feature.The "Compared to You" feature allows one to compare one's ratings history with public ratings histories is very useful. You may wish to add to a user's profile page the correlation of each user's ratings histories with the IMDb ratings.For instance, this feature would look like this for Col Needham:Compared to IMDb: +52Rated 8229 titles with 5 or more votesSimilar ratings for 4886 of them.Thinks another 2344 are better.Thinks 999 are worse.Liked less than you:Cavalcade, Lady in the Water, You Talkin' to Me?, 4.3.2.1, Random HeartsLiked more than you:Pink Floyd The Wall, Dancer in the Dark, Dead Alive, Alphaville, Stromboli 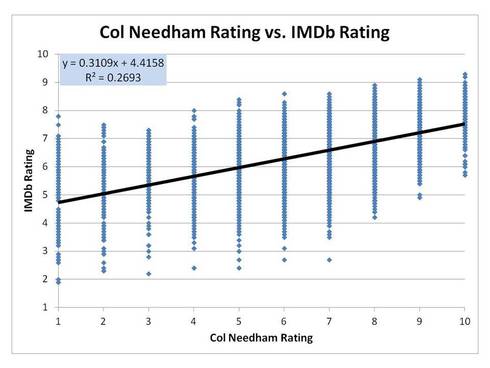
● FAQ: Key Threads - IMDb Poll FAQs Index
● FAQ: Summary Statistics and Poll Index
erik_boehm
2 Messages
•
178 Points
12 years ago
Movies Col Needham rated that you haven't and rated higher than a 7: Some Awesome Movie, A Hidden Treasure, A Flick You Had Forgotten About
0
0
dan_dassow
Champion
•
20.7K Messages
•
490.5K Points
12 years ago
With an advanced search and a little bit of link hacking you can build of the search for Movies Col Needham rated that you haven't and rated higher than a 7.
Generally, you probably would not be interested in Feature Films that have less than 5000 votes.
Highest Rated Feature Films You Haven't Seen With User Rating Between 7.0 And 10 and At Least 5,000 Votes
http://www.imdb.com/search/title?count=250&my_ratings=exclude&num_votes=5000,&sort=user_...
If you do not exclude films with 5000 votes or more you get a lot more films.
Highest Rated Feature Films You Haven't Seen With User Rating Between 7.0 And 10
http://www.imdb.com/search/title?count=250&my_ratings=exclude&sort=user_rating,desc&titl...
= = =
On Col Needham page you should see See all 8,640 ratings » After sorting this list by user ratings you get.
These are the titles that Col Needham has rated:
http://www.imdb.com/user/ur1000000/ratings?start=1&view=compact&sort=user_rating:desc&de...
If you exclude titles with ratings less than 7.0 and titles that you've rated you get this.
(append this to the end of the previous link: &user_rating=7.0,10&my_ratings=exclude)
These are the titles that that Col Needham has rated that you have not rated that are rated 7.0 or higher in descending order of rating:
http://www.imdb.com/user/ur1000000/ratings?start=1&view=compact&sort=user_rating:desc&de...
0
0
bc6841
6 Messages
•
160 Points
11 years ago
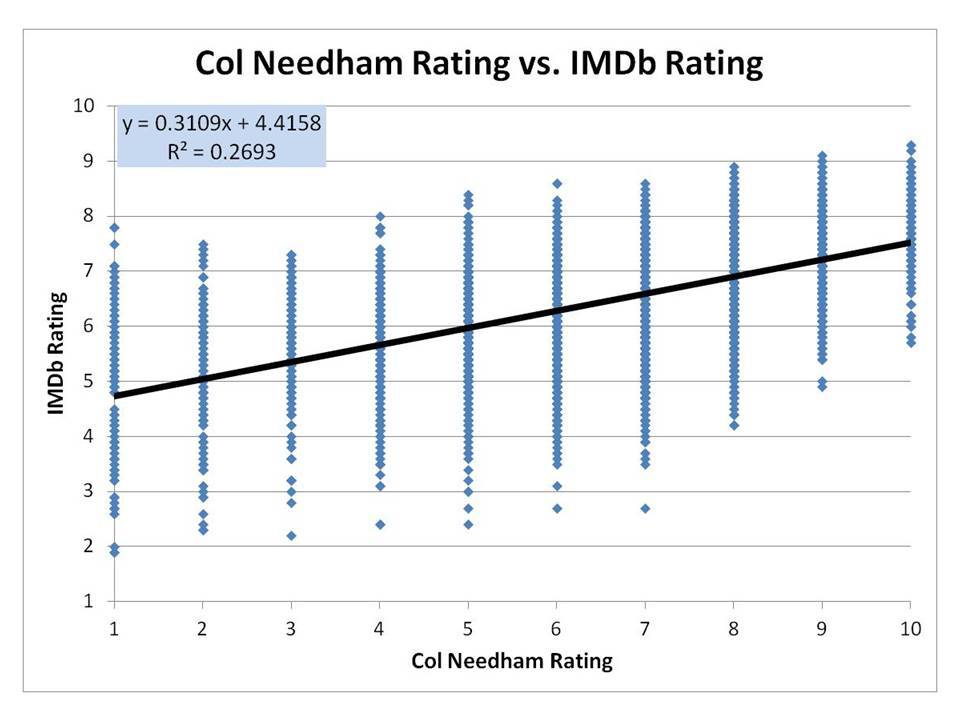
How do you compare your ratings to the public IMDb ratings?
And how did you get that correlation graph?
3
0